How to use it?
Search Genes
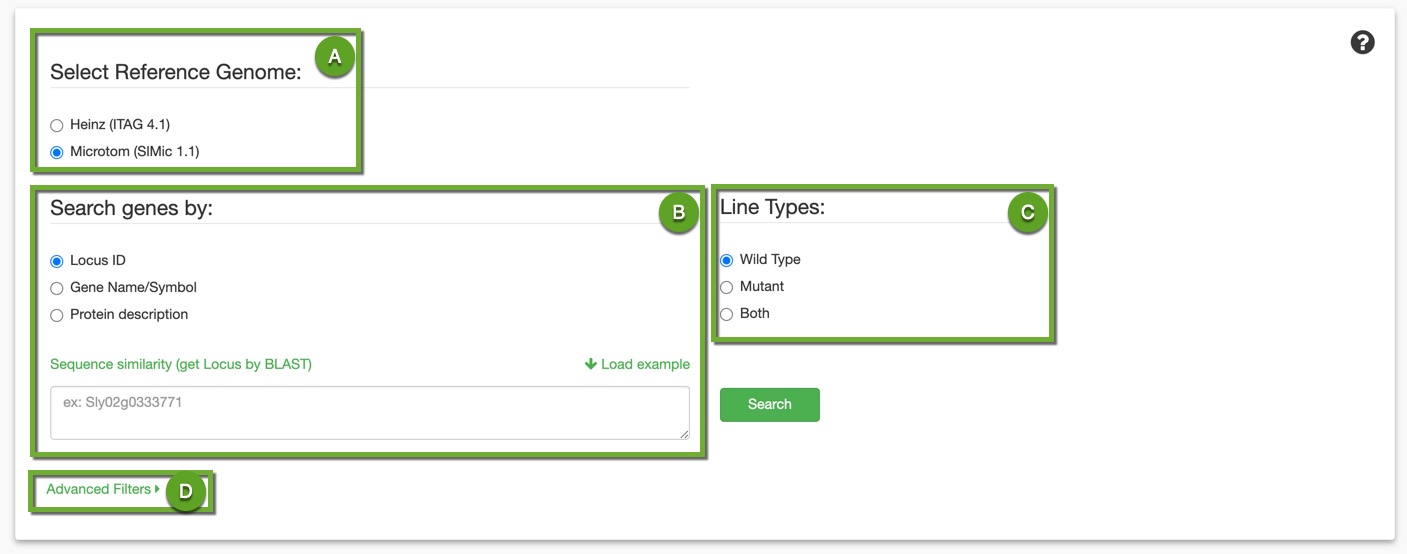
First, you need to enter your gene(s) of interest to get it/their expression values.
-
A. Set the reference genome you want to work with.
-
B. Search your genes using: Locus ID, Gene Name/Symbol, or ITAG description. If none of these gene identifiers are available to you but you have their sequences, you can use the solgenomics Blast link we provided there.
-
C. Filter your results by phenotype: wild type, mutant, or both.
-
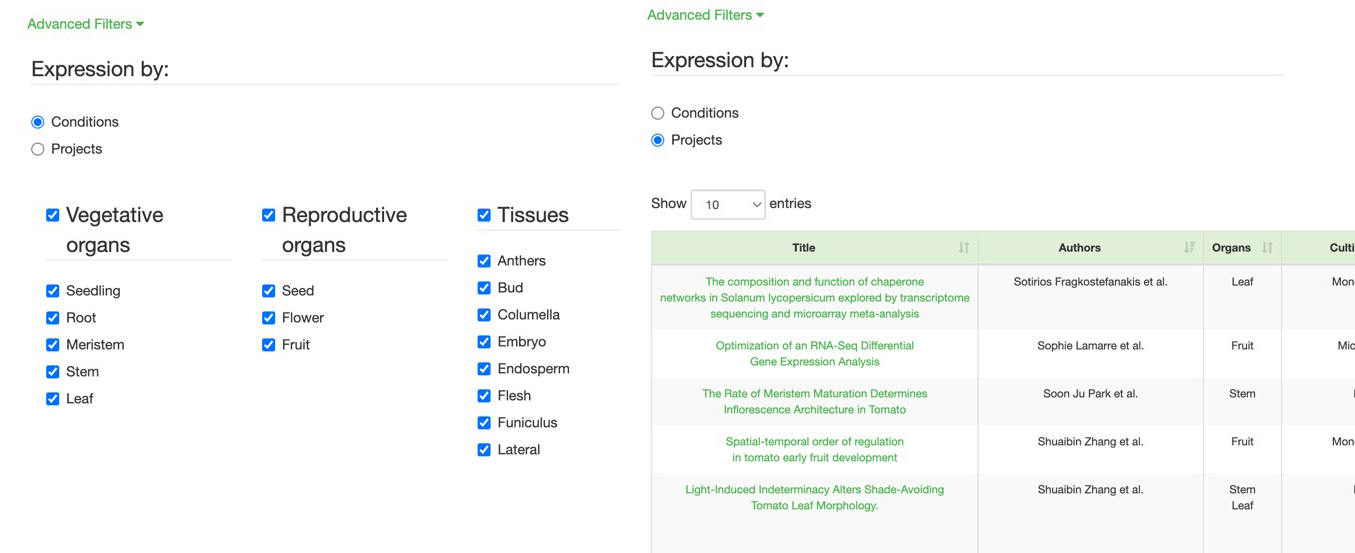
D. You also have an advanced search where you can filter your expression results by
Advanced Search : Expression By
-
Conditions (E): where you can choose the organ, treatment, and cultivar
-
Project (F): where you select a project, and the conditions used in it are the ones applied to your gene query
Select Genes of interest
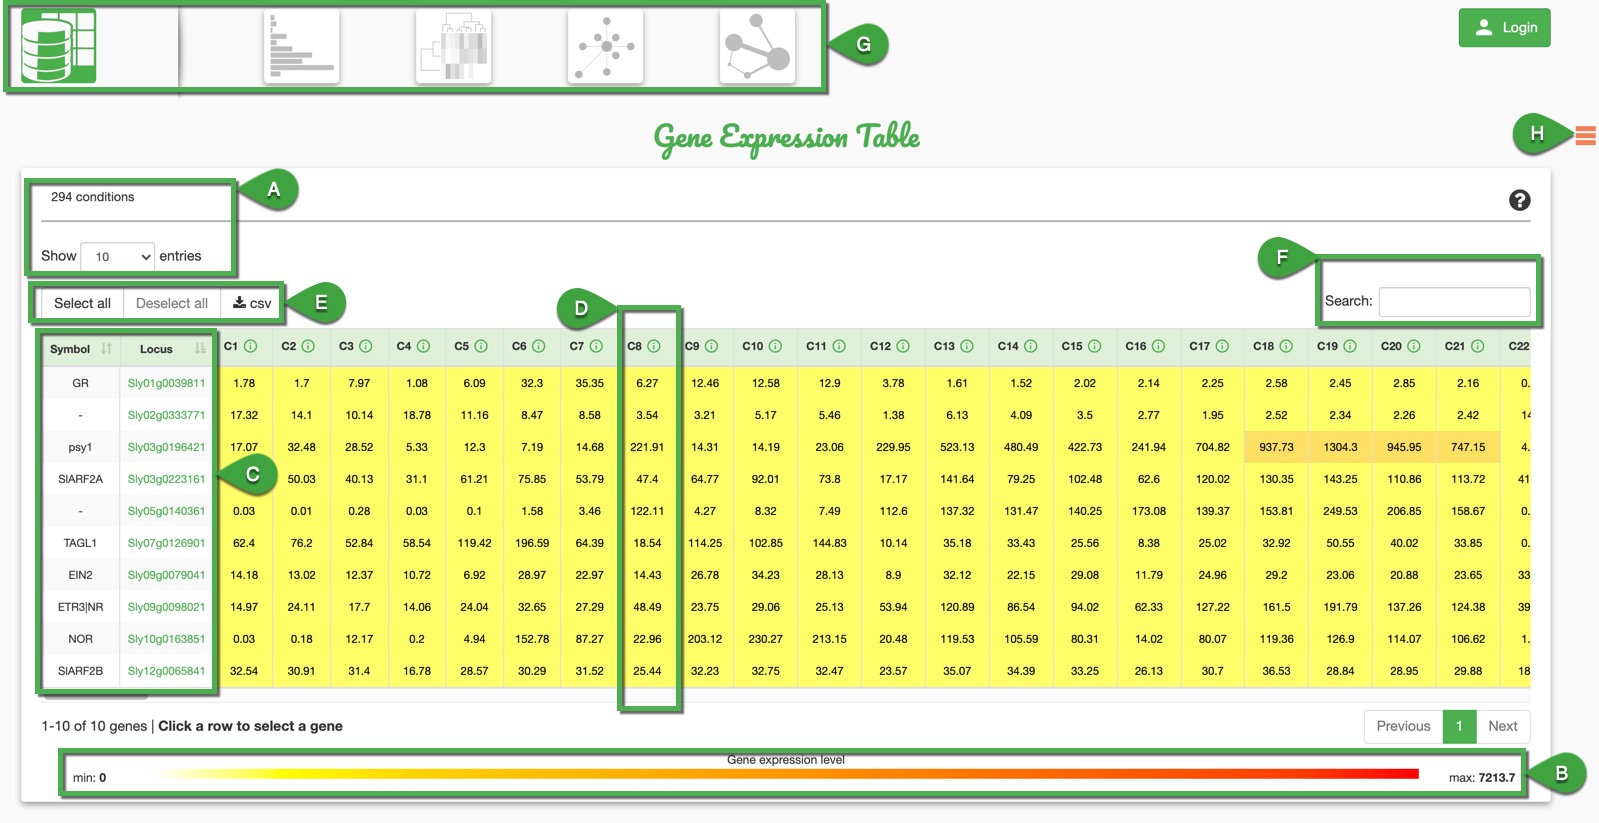
The result is displayed as a table with all the genes fulfilling the selected criteria. This table is organized as follows:
-
A. Number of genes: Total number of genes that match the request. It is possible to select the number of entries shown per page in the table.
-
B. Expression Range: Here you can see the minimum and maximum expression values for the current set of genes.
-
C. Gene Information: Here you can have the Gene Locus ID and, if available, the corresponding Gene Symbol. You can select the genes for which you want to visualize the expression by clicking on each row.
-
D. Expression per Condition: Conditions covering the user's request are numbered starting from C1 to CX where X is the number of conditions corresponding the research prerequisites. For each expression value, details about related conditions can be seen by clicking on the information mark button.
-
E. Selection and Export: You can select or deselect all genes in the table. The CSV button allows exporting a csv file with the selected genes on the selected conditions.
-
F. Table Filtering: This text field allows the user to filter the entries of the table using the gene name, symbol, and even expression values. Useful before any gene selection for statistic visualization.
-
G. Visualization Choices: After selecting the genes, you can click on the icons outlined in green, which represent different visualizations:
- - Gene Expression,
- - Expression HeatMap,
- - Most Correlated Genes
- - Expression Network.
-
H. Legend Display: Conditions may be displayed with some abbreviations on plot legends. By clicking on the "burger" button you can display all abbreviations definitions.
Visualization
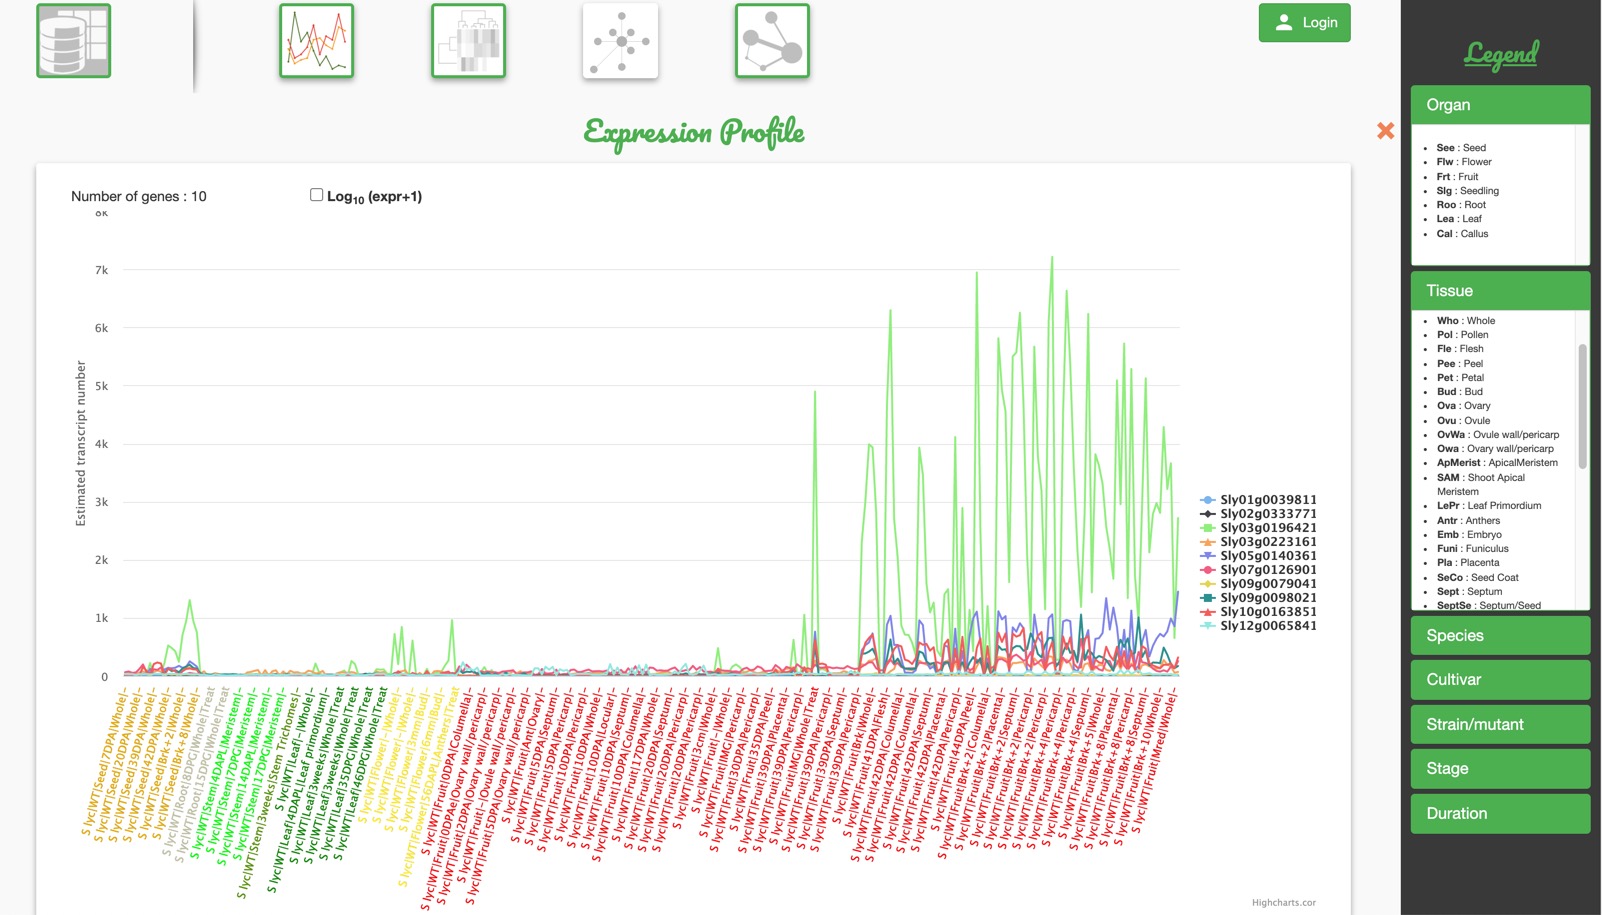
Gene Expression


This tool helps to visualize gene expression profiles within the previously chosen developmental stages, tissues, cultivars and/or other biological conditions.
If only one gene has been chosen, then a bar plot is built with a color legend indicating the tissue type. If more than one gene has been chosen, a line graph is built with a line associated to each gene. To zoom in, you can select the desired area with the mouse.
For both of the figures below, ordinates values can be plotted using the raw expression values or using a logarithmic scale (log[expression+1]) (A). Using these scales will respectively highlight high or low expression values. You can also print or download the generated graph (B) in different image formats.
Expression HeatMap

This statistical tool helps to visualize
the expression heatmap of the selected
genes and conditions.
Obviously, more than one gene must be selected to compute the heatmap.
You can custom the display of your heatmap by:
-
A. Changing the metrics used for clustering: Euclidean distance or Pearson correlation
-
B. Choosing whether or not to clusterize the biological conditions
-
C. Changing the scale of expression values: linear (by default), or logarithmic using log(expression+1)
-
D. Modifying the color settings
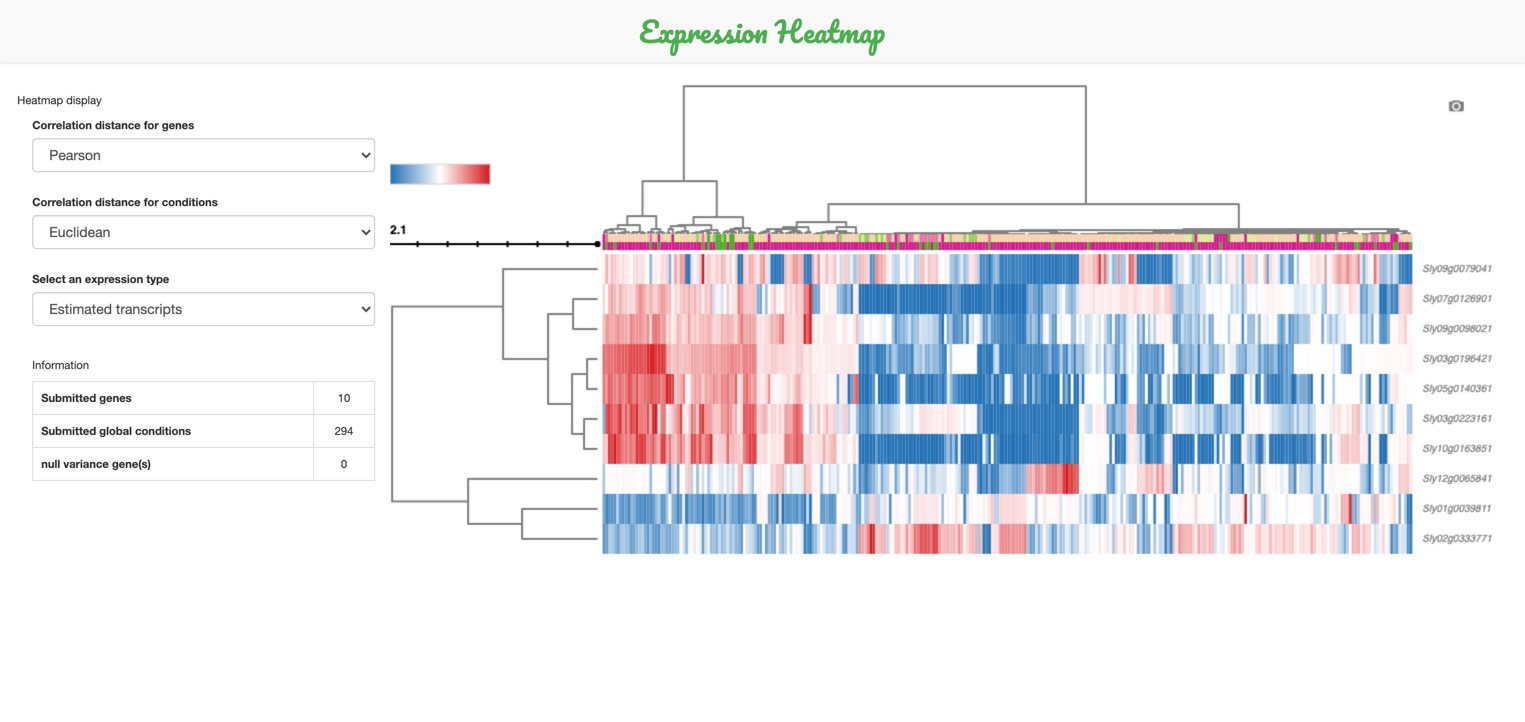
E. The heatmap can be downloaded by clicking on the camera icon on the top-right corner.
-
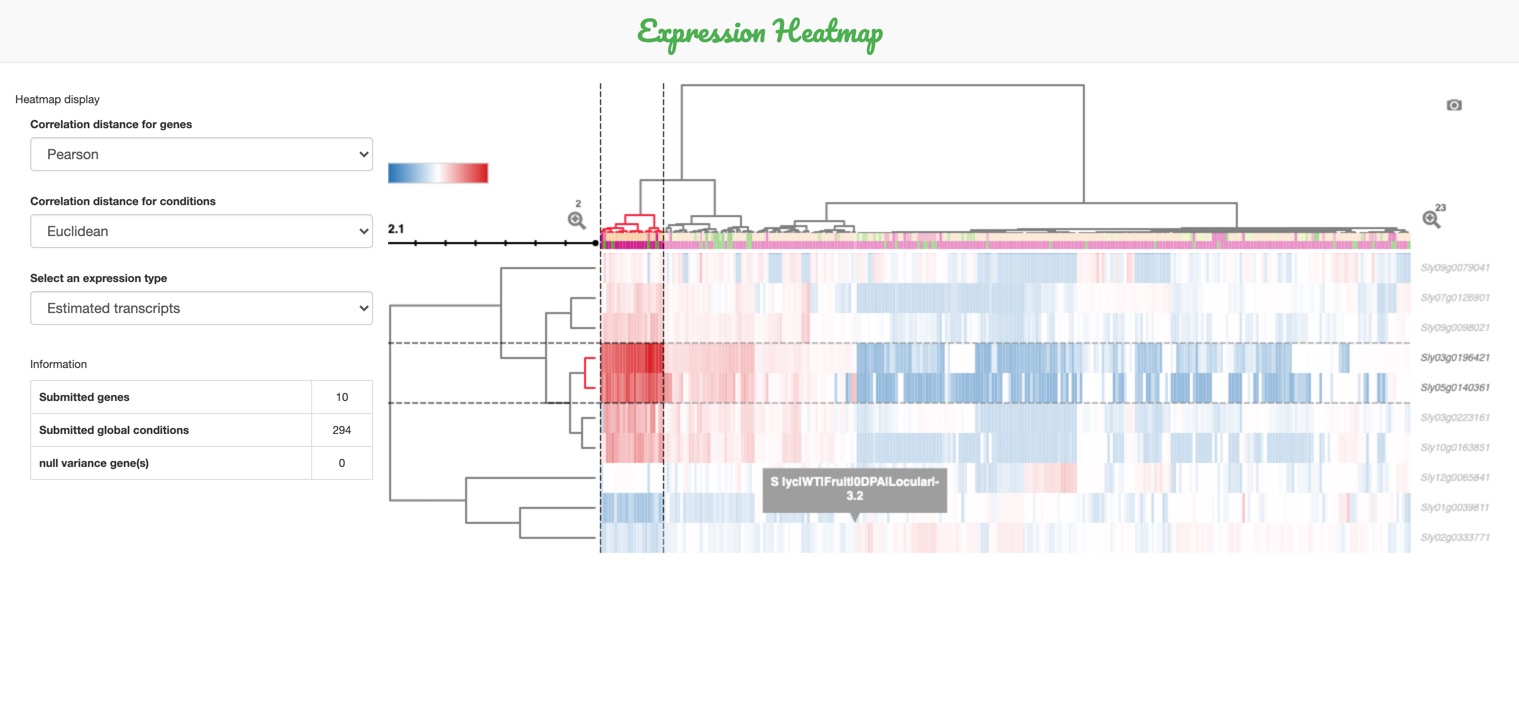
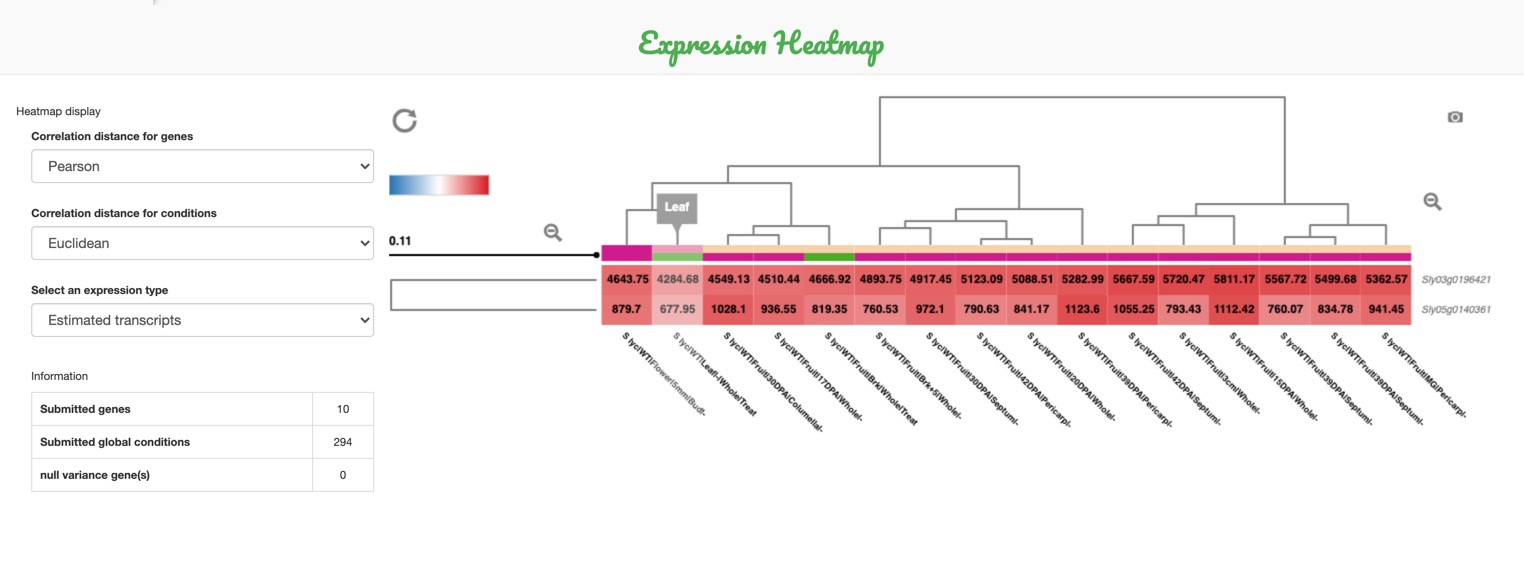
- Target the desired area using a cluster of interest from the dendograms (on the sides of the map).
-
- Click on the zooming icon, or hold click on the dendogram and it will automatically zoom in.
The heatmap can be zoomed-in:
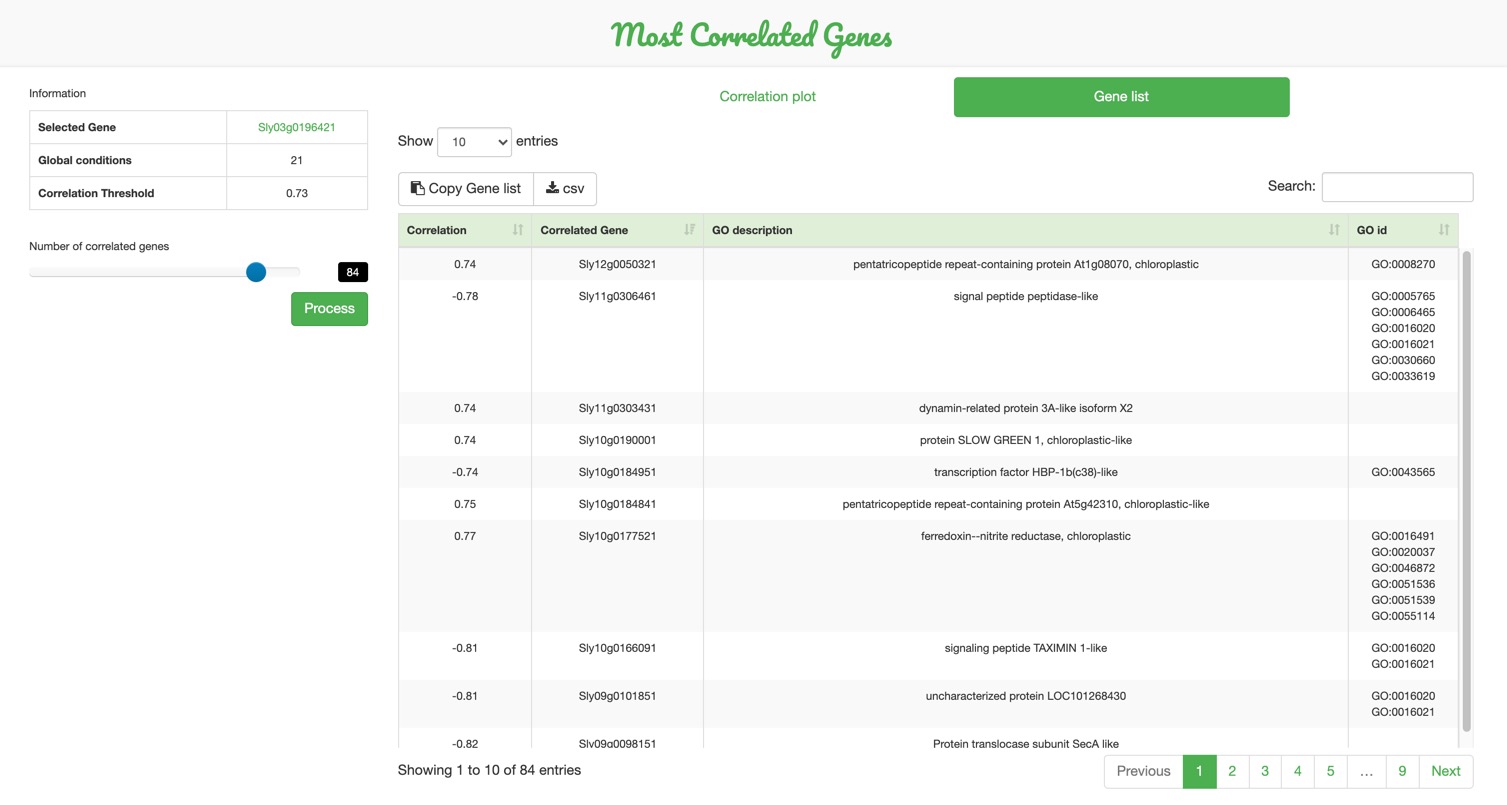
Most Correlated Genes

This tool gives the list of the most correlated genes to the selected one within the previously chosen conditions.
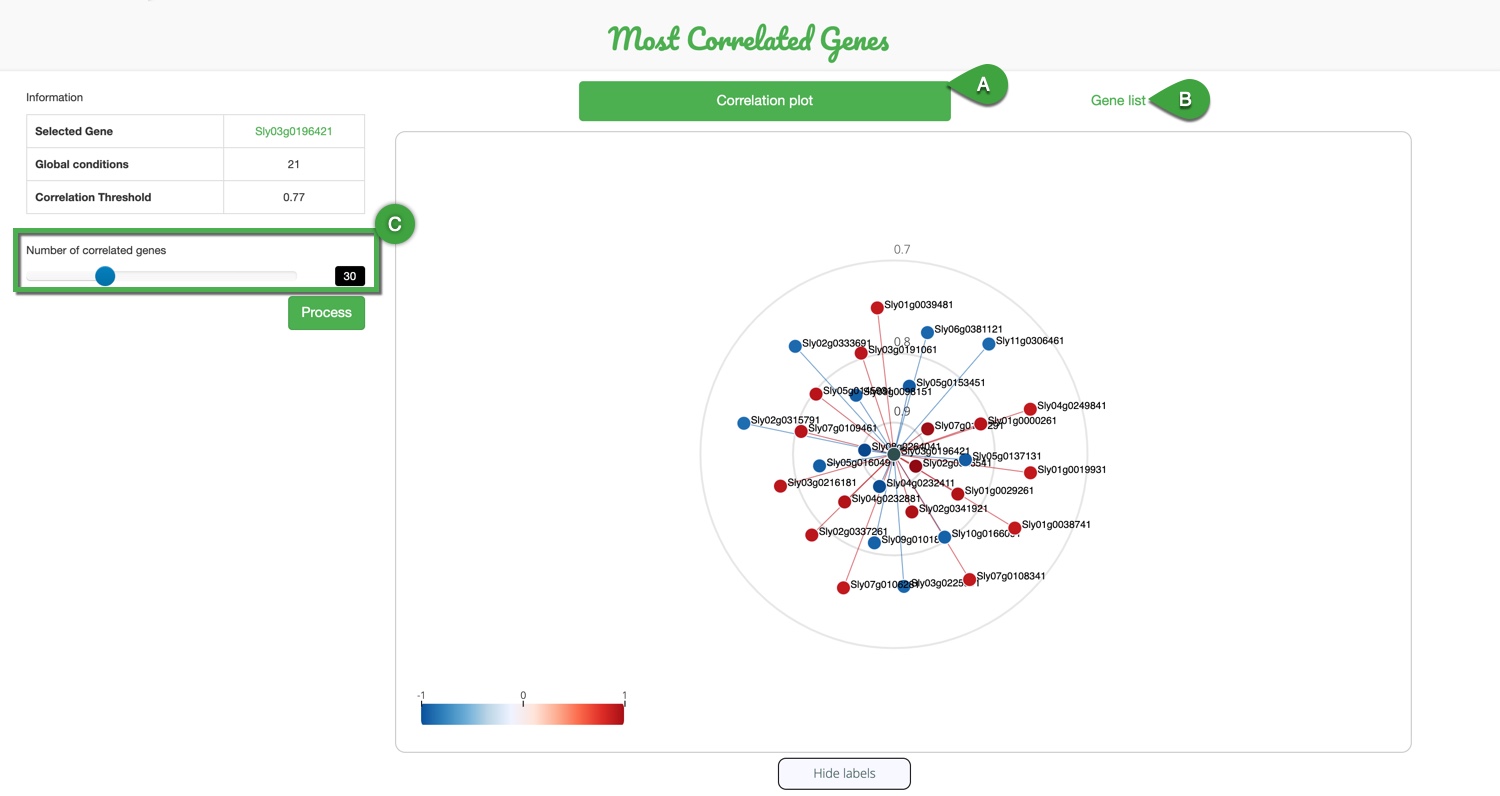
A. you will get a correlation plot with the gene of interest centered and the correlated genes around with the most correlated closer than the least correlated
C. The number of correlated genes can be chosen with a range input going from 1 to 100 the default value being 30
B. A correlation table can be displayed and exported in a second tab
Correlation Network

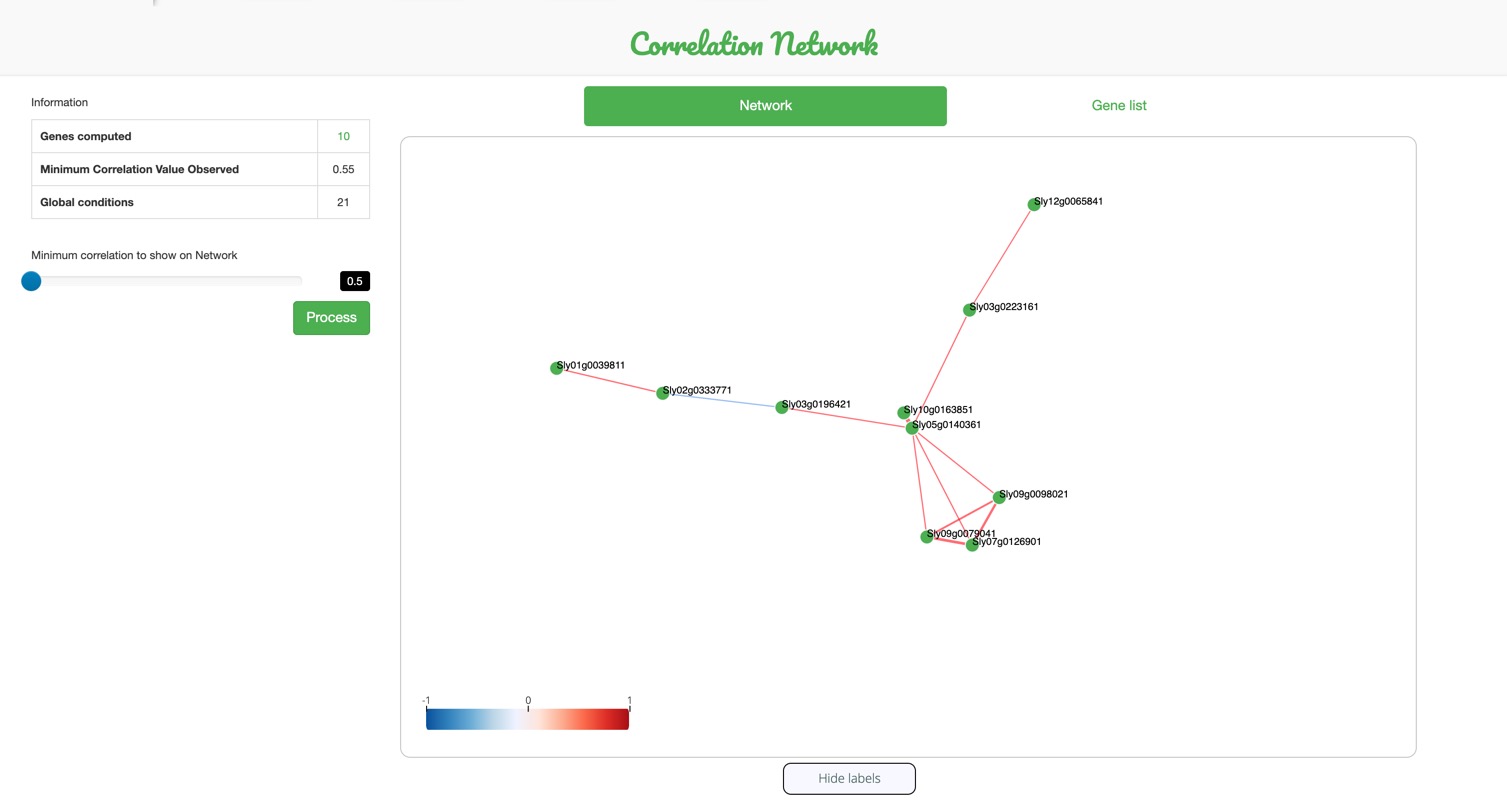
This statistical tool allows the visualization of
gene networks, where genes are correlated
to one another depending on their levels of expression within the developmental stages, tissues, cultivars and/or other biological conditions previously selected.
This tool finds correlated genes in terms of their expression values.
The table displayed (A) contains a summary of the correlation results.
The minimum correlation value can change by playing with the range input (C)
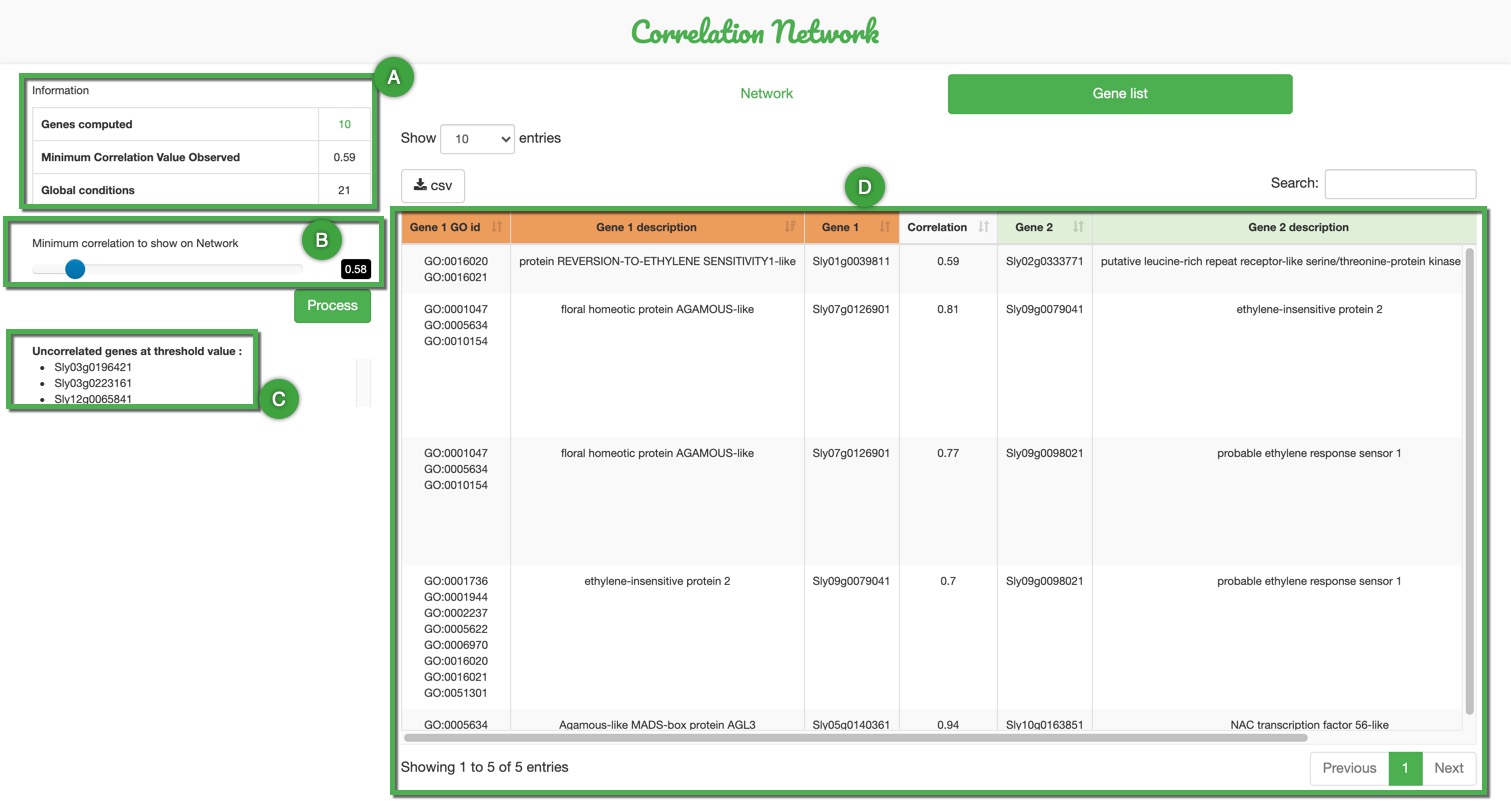
Apart from the Network itself this tool outputs an exportable table with all implied genes description and correlation values (D).
Statistics
Some statistics have been generated to provide an overview of the database.
You can find the number of projects
that have been analyzed and their total number of corresponding biological samples.
You can also find the number
of conditions described from all these samples.
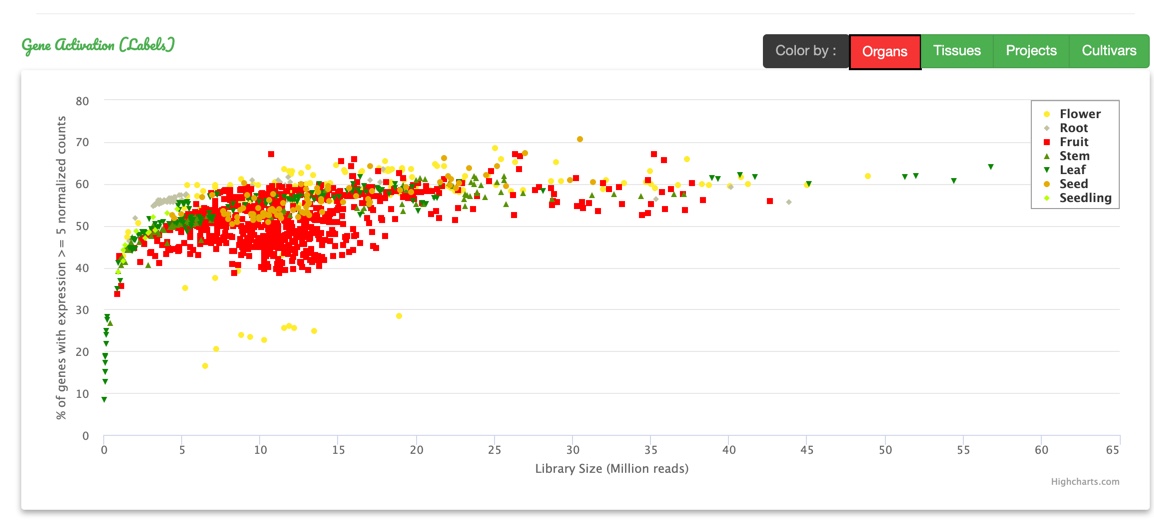
The wide variety of samples is highlighted given some information about the sequencing technologies, the library sizes and the species and cultivars studied.
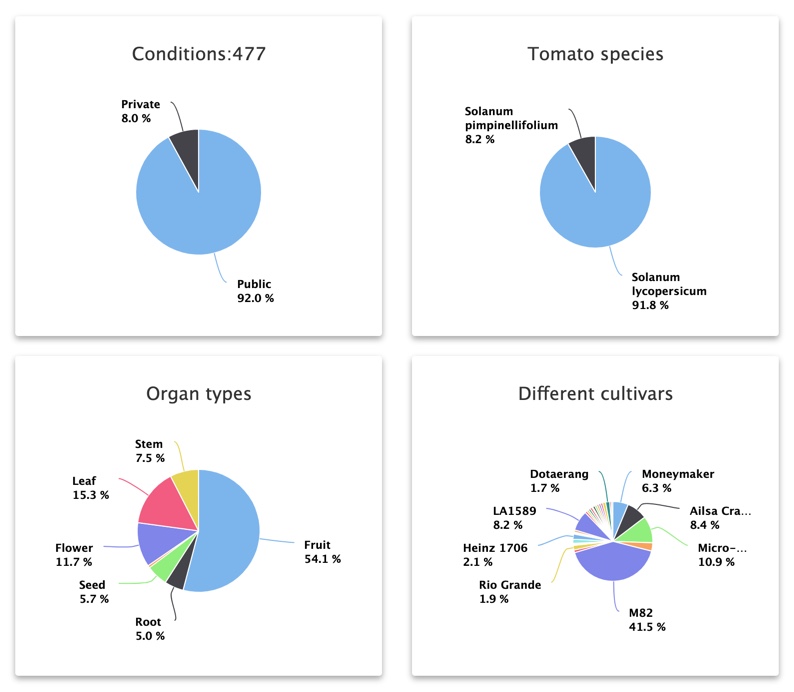
Each reference genome, on which the data have been analyzed, owns its statistical description regarding different metrics processed during analysis in a separate tab.
It gives insight on the quality of each sample analyzed and its characteristics.
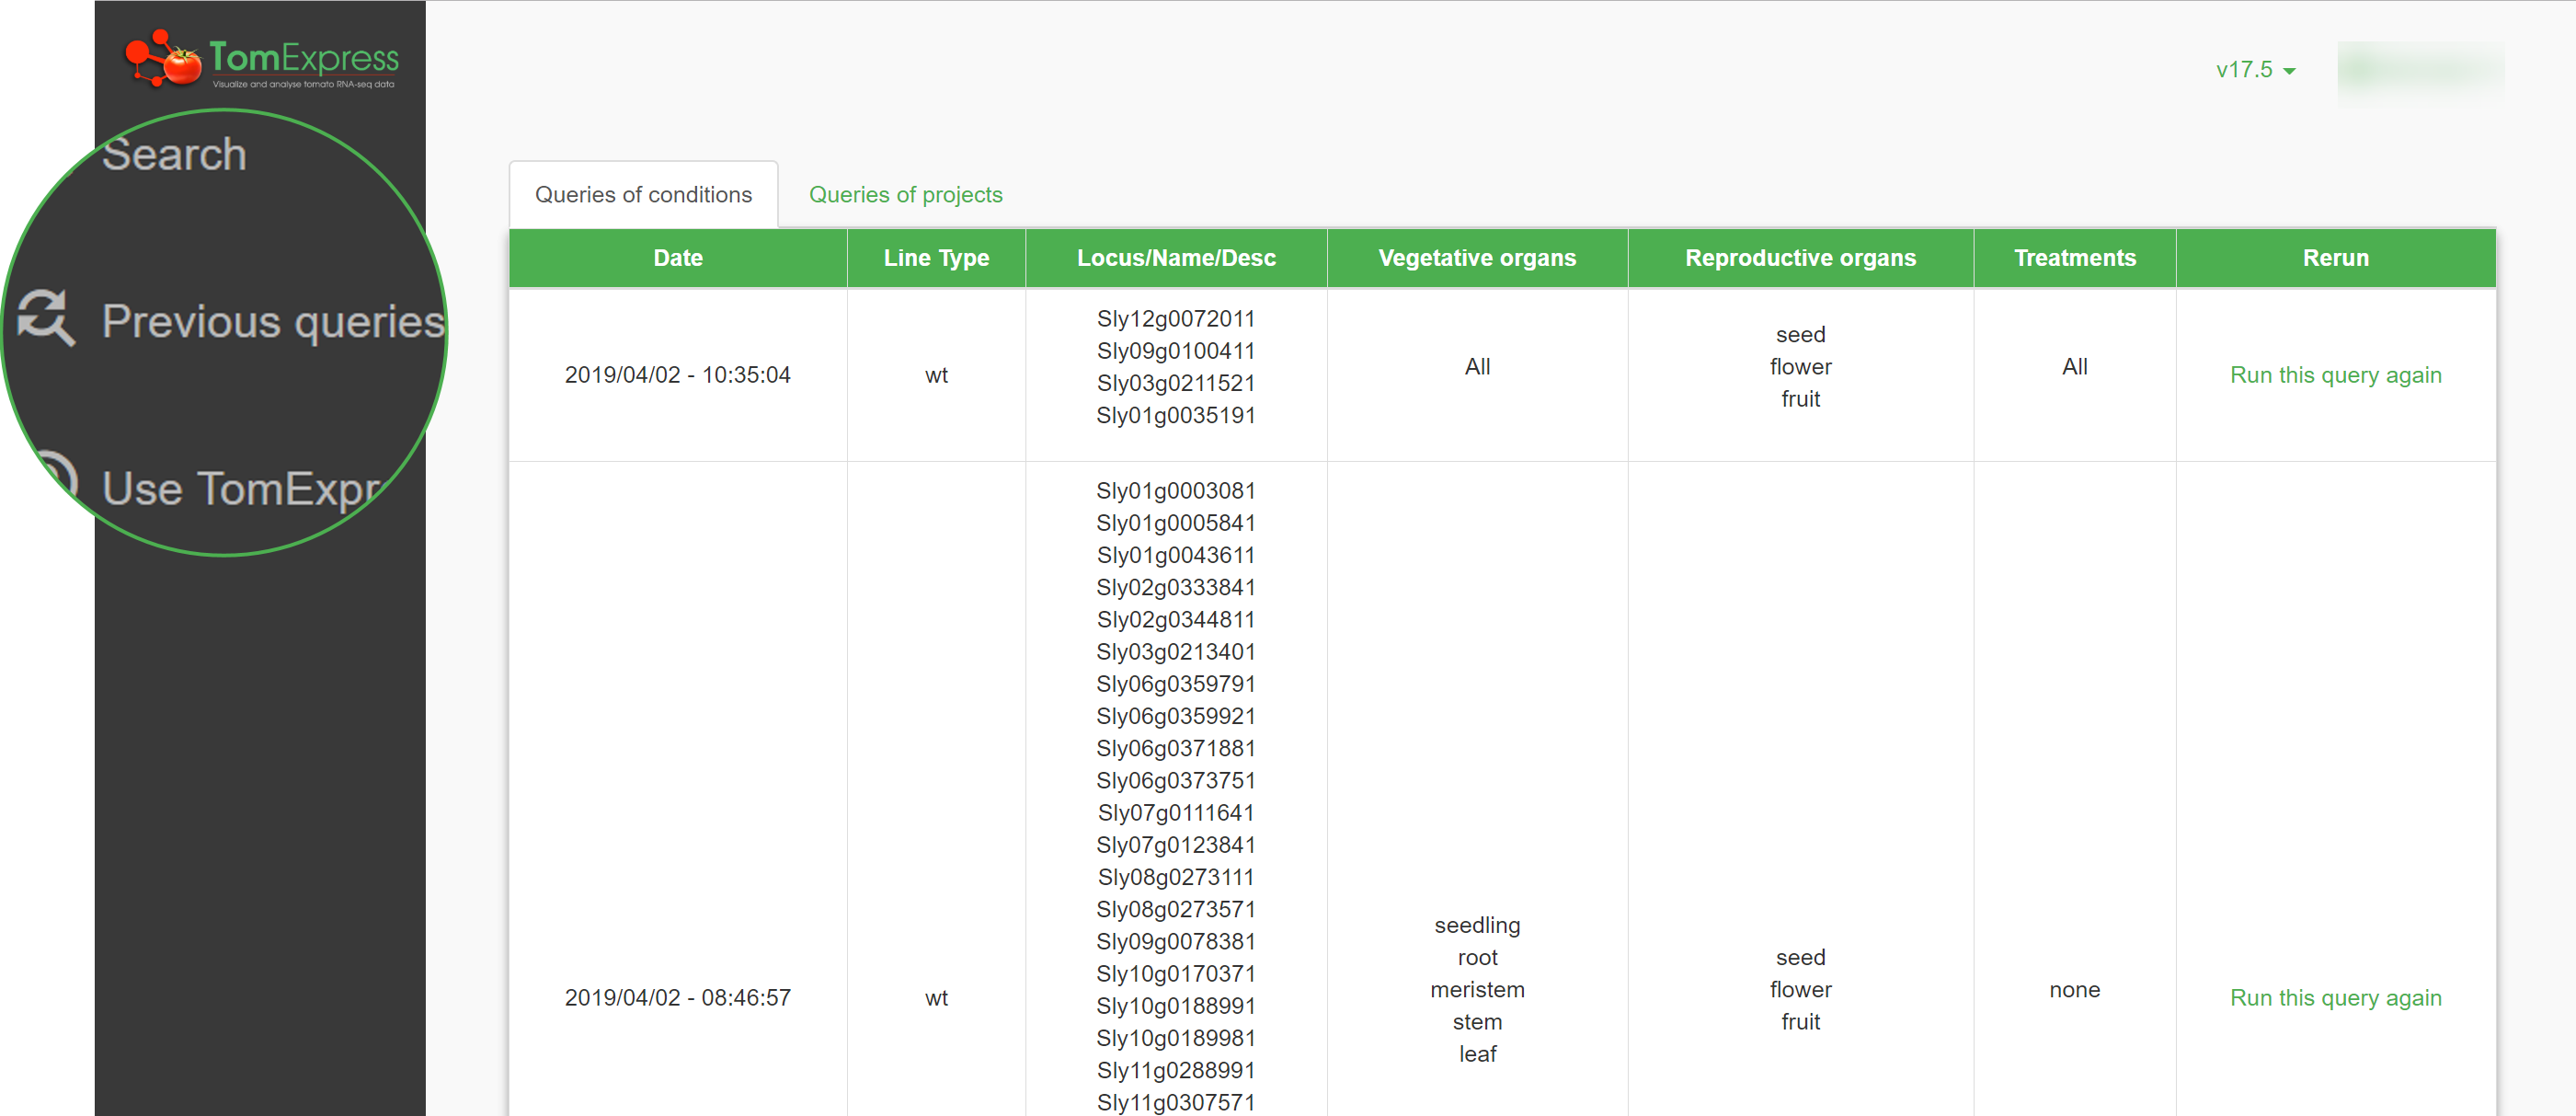
Queries History
If you want to search queries you have previously made, you don't have to redo the entire request! Your queries are saved in a history so you can easily reuse them.